As a business’s operation expands, it produces complex data that requires analysis and interpretation to better create corporate guidelines for maximum efficiency.
According to a study, 65% of people learn better through visuals than text.
That is where heatmaps come in handy!
Contents
What is Heatmap?

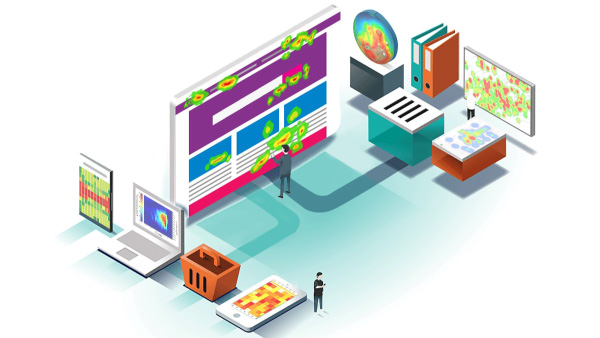
Heatmap is a way to visually analyze the data that your website provides, in a color-coded scheme graphically to get insights into your visitor’s actions on your website.
It is a great tool for website conversions and helps you to know how your visitors behave with your website and to know what works for your website and what does not.
Some of the ways where heatmaps help you attain maximum efficiency are:
- Attaining the ideal length of the page
- Ensuring Call To Action (CTA) Buttons working for your audience
- Ensuring easier navigability throughout your website
- Identifying maximum hyperlinking opportunities
- Identifying the most and least visited sections and improvising them
What is Real-time Data Visualization Through Heatmaps?

Heatmaps help you visualize data in real-time.
Real-Time data visualization through heatmaps basically refers to data that is frequently updated without any lag. Also, it tracks each and every movement that your user makes and shows you a real-time updated version of the interaction of your user with your website.
Different types of data visualization using different types of heatmaps.
What are the Different Types of Heatmaps for Data Visualization?
Heatmaps show the color-coded scheme as hot and cold spots representing the warm to cool scheme based on your user’s activity on your website. The warm section i.e the most interacted section is usually represented by red while the cool section i.e the less interacted section is represented by different shades. The color scheme can also be altered as per your choice.
Some of the different types of heatmaps are as follows:
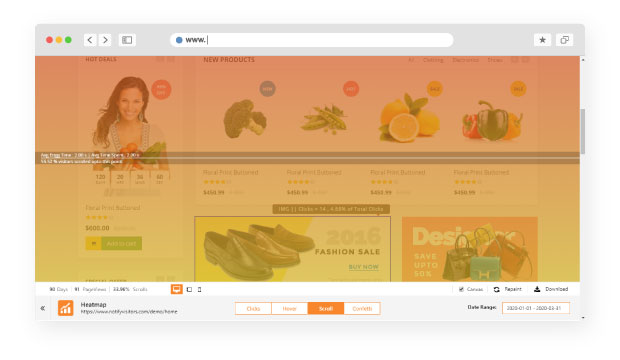
1. Scroll heatmap:
A scroll map helps you provide data to understand each and every section of your webpage that is scrolled by the user.

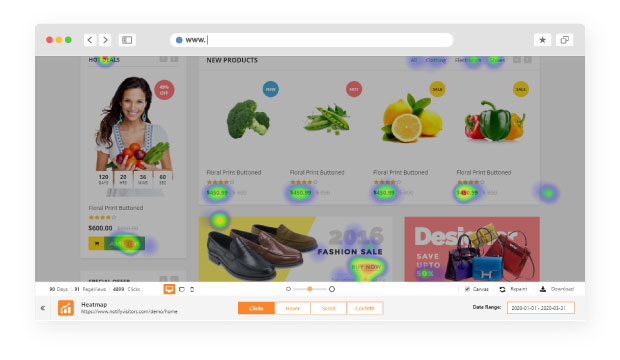
2. Click heatmaps:
A click map helps you provide data to understand the clicks on your webpage. Thus, it’ll give you a detailed analysis of the most clicked section, clickable/broken links and CTA’s, etc.

3. Mouse Tracking Heatmaps:
A mouse tracking map helps you provide data on the basis of your user’s mouse movement on your website. It gives you data such as the sections where the user’s mouse hovers the most and least on your webpage.

4. Eye-Tracking Heatmaps:
Eye-tracking provides you heatmap data visualization on how the visitor’s eye travels throughout your webpage. So, this map helps identify the sections which grab the user’s attention the most, the most fixated sections, the attractiveness of CTA’s, etc.
All these different types of heatmaps solve different purposes.
While designing your website, you need to set your goals as to what is the purpose of your website and based on that select the heatmap that can be of use to you while you plan on a journey to be a giant name in the industry who has a strong online presence.
Conclusion
Heatmaps act as a great guide for you to understand what works on your website and what does not – what CTA’s work the best, which are not as effective, how far your visitors scroll through your website, the ineffective section of your website, etc.
Therefore, it is a great tool to enhance your user’s experience and the performance of your website or your application.
Now that you know what exactly Heatmaps are, get going to designing that perfect Website you always desired using Heatmaps.
FAQ’s
1. How do heatmaps help?
Heatmaps mark the regions of high visitor activity in warm colors and those with lower activities in cooler colors. Knowing this helps you optimize your web content to increase conversions.
2. What are the ways in which heatmaps help?
Heatmaps provide valuable insights into the ideal page length, the right CTAs, hyperlinking opportunities, simplifying website navigation, and improvising pages for better user engagement. Thus, they help enhance your UX.
Also Read:


 Email
Email SMS
SMS Whatsapp
 Web Push
 App Push
 Popups
 Channel A/B Testing
  Control groups Analysis
 Frequency Capping
 Funnel Analysis
 Cohort Analysis
 RFM Analysis
 Signup Forms
 Surveys
 NPS
NPS Landing pages personalization
  Website A/B Testing
  PWA/TWA
 Heatmaps
 Session Recording
 Wix
Wix Shopify
 Magento
 Woocommerce
 eCommerce D2C
  Mutual Funds
 Insurance
 Lending
  Recipes
  Product Updates
 App Marketplace
 Academy

