Heatmap put a macroscopic view on the user’s activities and intentions, whether it is used for B2B or B2C business purposes. Read the blog to know why heatmaps are a diagnostic tool.
The main aim of any business revolves around generating leads and driving more traffic to the website. Also, it would help if you put on more effort in B2B marketing in comparison to B2C. It would be best if you looked at the leads as potential customers. Therefore each step you take to turn them into one must be done with perfection and precision, such as pointing out the USP of your brand or personalizing customer’s experience, and providing them a flawless navigation experience.
Therefore, whatever you do to turn them into potential customers, needs to be sorted out correctly. And heatmaps diagnostic tools come into existence for the same purpose, i.e., you need to collect enough information and conclusions about the conversion rates. Therefore you need a tool that diagnoses everything right from – users click on the elements to what they view on your website to the ignored areas of the sites.
Heatmaps – add colors to your business growth.
When we put effort into something, we need our share of results too. Heatmap is a smart diagnostic tool which uses color codes to depict the areas where users are concentrating more and the areas which remain unfocused.
Contents
Why is heatmap a diagnostic tool for B2B marketers?
B2B marketing is more robust than B2C marketing, as leads are quite expensive, and they have to indulge in long accounting and legal processes. Therefore there is less traffic. It would help if you had Heatmaps to generate the traffic by analyzing what is stopping your leads for conversions.
How can you form a hypothesis through heatmaps to bring improvement to your website, below are some points to consider :
1.Understand the numeric values in the form of visuals:
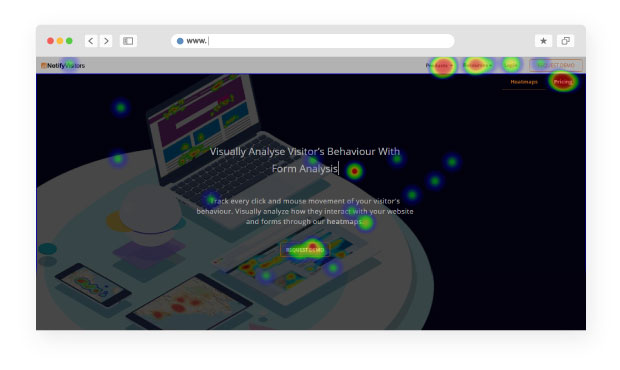
Like an X-ray depicts the defaults and illness in a body part, similarly, the heatmap is an X-ray image of your website. A single heatmap can depict valuable statistics to show you a page with lower engagement rates or the elements which are not giving you productive results.
Note: Heatmaps show you the pain points which a visitor might encounter while a browsing session. Further, you can take necessary actions to improve the fall down of your conversion rates.
2. Design your website quickly through heatmaps:
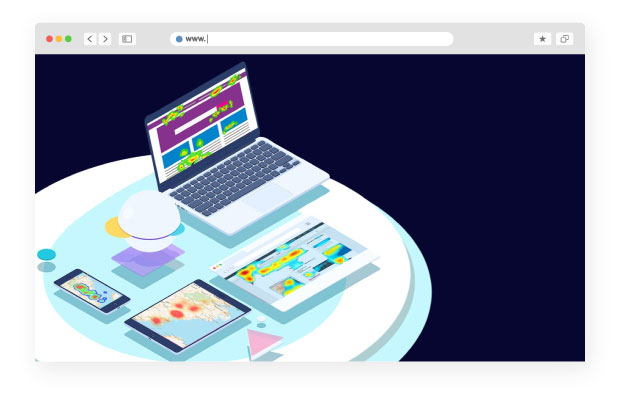
Analyzing audience behavior is quite essential in gathering unique insights about the customer and, in turn, design the websites. You cannot use surveys and forms to design or redesign the sites as they can be biased forms of collecting information. Therefore, heatmaps come in handy at the right time to analyze the navigational patterns of users.
For example, – You can know the maximum clicks on your “about page.” Checkout which CTAs got more clicks and which got fewer clicks.
3. Analyze CTAs performance:
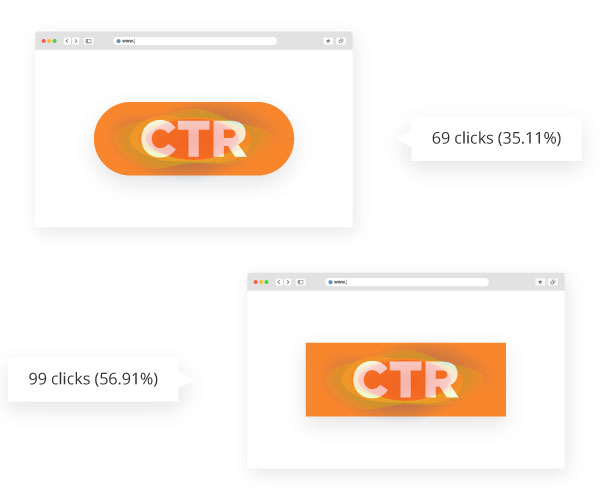
CTA is a prominent element of your landing page is it on a banner ad or in between your article or blog. You can combine heatmaps with AB testing for more effective results. Make two or multiple variations of the elements and analyze the elements in which one gets more conversions.
4. Reduce the form rejections:
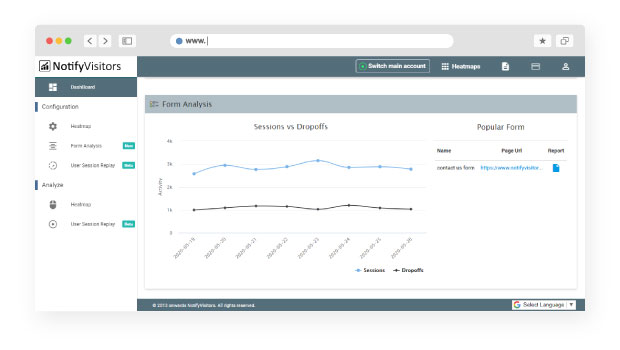
Forms play a vital role in gathering information from the customers visiting your site. If only you can optimize the forms, you can easily attain conversions. The easiest way to optimize forms is to see which type of form will provide you with productive results.
A saas company analyzed the form on their checkout page. They did the form analysis and found out that many people were not filling the form on the checkout page. Why? The referral code fields were the main reason for it, as people could not find the codes to avail of the discounts due to which they were abandoning the purchase.
How to blend heatmaps with other diagnostic tools :
1.Complement other tools with heatmaps:
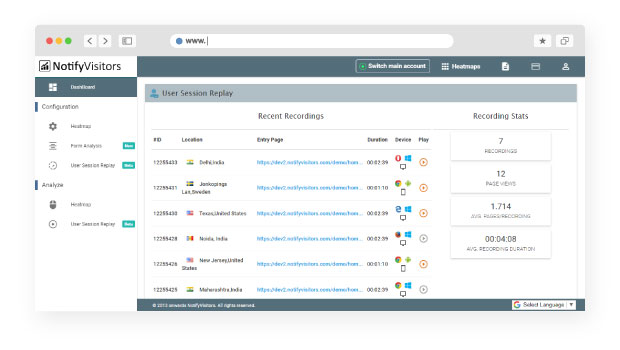
Heatmaps are a unique diagnostic tool, but it doesn’t mean you can entirely depend on them to get all your answers. You can combine them with other toolkits, such as user session replay, ab testing, and watch out for powerful results.
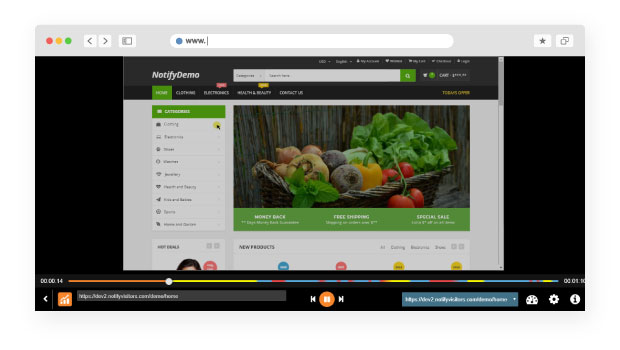
User session replay is like video playing out of how your users are interacting live on your website. You can also rewind the session and see the user who is leaving and returning to your sites from different devices. Simultaneously, user feedback will tell you how users will feel about you. These power pack tools, along with the heatmaps diagnostic tool, will allow you to leave no stone unturned in analyzing users.
2. Heatmaps alone can be a bit confusing:
If you are using heatmaps for the first time, you may find them confusing as the color representation could be a bit fussy. Therefore, if you find it tricky, use it along with the other tools.
3. Know your users better and improvise their experience :
Designing a website is, in itself, a visually communicative act. Whatever your conversion goals, what matters is how your users are communicating with it, it means how they are reacting to the messages of the elements. So, that you can find out a different way of formulating your messages and users understand them instantly.
The friction score on the heatmaps diagnostic tool scan helps you figure out what is distracting the users and what is irritating them. These tools help you track data points to find out what is frustrating and what attracts his attention and what deviates his mind. You can use heatmap filters to get an idea of how different audiences are reacting to an individual message.
This way, you can customize their experience pretty well.
4. Get an instant view of key parameters :
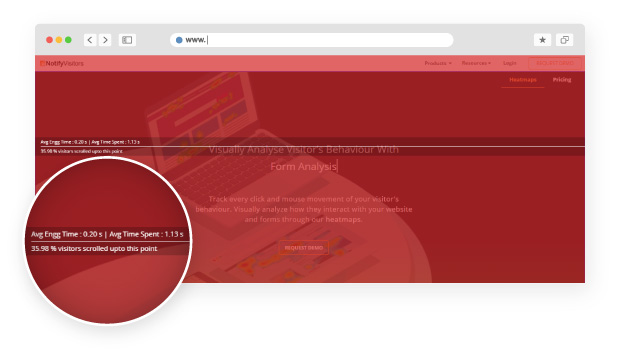
Each analytical tool has its core strengths, but heatmaps can help you out in focusing on the significant issues of the website. Click heatmaps to help you know the clicking patterns of the website. Scroll heatmaps help you analyze the average visibility of the pages. Movement heatmaps help you cover out the mouse movements. Similarly, geo heatmaps identify the user’s location. Collaborating with every tool enables you to simplify the user journey and his experience.
For example Geo heatmaps reveal the countries where you are attempting to find reasonable conversion rates and where you are not getting conversions at all. Also, the cold spots show you the areas where you need to pay more attention, and the folds in the scroll maps help you identify the problematic areas.
Conclusion:
Heatmaps are a powerful and magnetic analytical tool to help you make better choices with designing websites. Also, you can drive more traffic and earn higher returns on investment.
Also Read:


 Email
Email SMS
SMS Whatsapp
 Web Push
 App Push
 Popups
 Channel A/B Testing
  Control groups Analysis
 Frequency Capping
 Funnel Analysis
 Cohort Analysis
 RFM Analysis
 Signup Forms
 Surveys
 NPS
NPS Landing pages personalization
  Website A/B Testing
  PWA/TWA
 Heatmaps
 Session Recording
 Wix
Wix Shopify
 Magento
 Woocommerce
 eCommerce D2C
  Mutual Funds
 Insurance
 Lending
  Recipes
  Product Updates
 App Marketplace
 Academy

