
 Email
Email SMS
SMS Whatsapp
 Web Push
 App Push
 Popups
 Channel A/B Testing
  Control groups Analysis
 Frequency Capping
 Funnel Analysis
 Cohort Analysis
 RFM Analysis
 Signup Forms
 Surveys
 NPS
NPS Landing pages personalization
  Website A/B Testing
  PWA/TWA
 Heatmaps
 Session Recording
 Wix
Wix Shopify
 Magento
 Woocommerce
 eCommerce D2C
  Mutual Funds
 Insurance
 Lending
  Recipes
  Product Updates
 App Marketplace
 Academy
In these release notes, we’ll highlight the enhancements made to our panel during January. Our team has implemented improvements across various aspects of the console, such as the funnel, user flows, scheduled reports for custom boards, date-wise open and click rate for recurring campaigns, price drop and back-in-stock business events, and much more!
This announcement will touch on several key topics designed to optimize your campaigns and streamline your marketing efforts. These topics include:
- User flow analyses
- Funnel strict ordering feature
- Funnel breakdown Feature
- Schedule reports for custom boards
Let’s dive in:
1. User flow analyses
The User Flow feature allows you to visualize and analyze how users interact with your web and mobile applications. It helps uncover insights into user journeys, identify popular paths, detect drop-off points, and optimize experiences to enhance engagement and conversions.
› Navigation
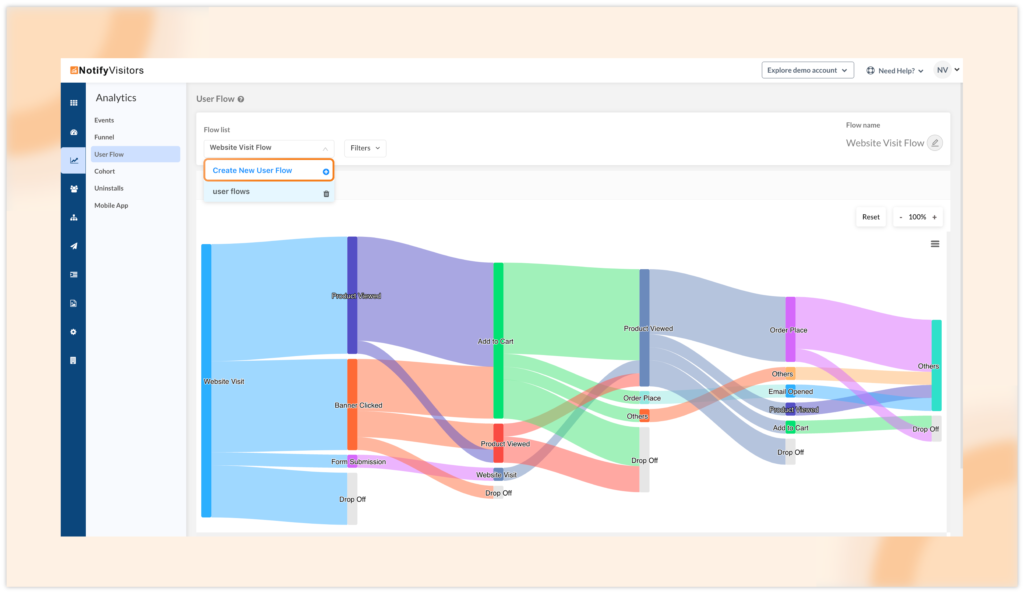
To access this feature, go to the analytics section and click on the user flow tab.
- If you’re new to this tool, you’ll directly get filter options to create a new flow.
- If you’ve previously created user flows, you’ll see a flow list, where you can select an existing flow from the dropdown or create a new one.
› Filter Options
Next, you’ll get filter options to design the flow preview:
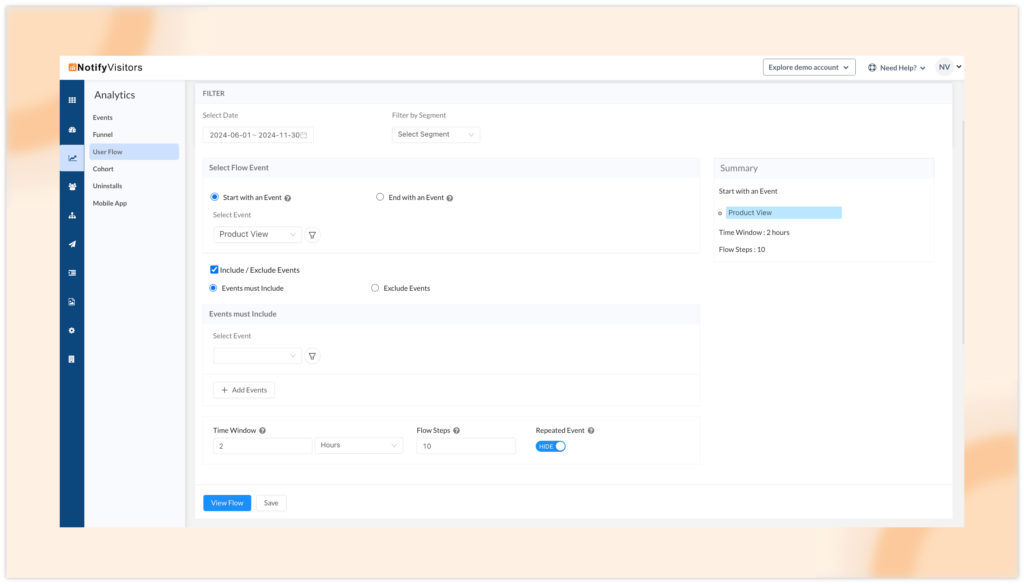
Select date: Choose the time frame for which you want to analyze user path data.
Filter by segment: If you wish to focus on a specific group of users rather than all users, you can select a particular segment.
Select flow event: Here, you can choose a specific event with the conditions “Start with an event” or “End with an event.” If you opt for a start event, you’ll see all user paths (event trails) that follow the selected event. Conversely, if you choose an end event, you’ll see all user paths (event trails) that occur before the selected event.
Include/Exclude events: You can add multiple events along with their attributes to either include or exclude from the user flow analysis based on your needs.
Time window: Specify the desired time frame to analyze user paths that occurred within a certain duration.
Flow steps: Indicate the specific number of steps (events performed) for which you want to analyze the path.
Repeated event: Choose whether to hide consecutive occurrences of the same event.
› Flow chart
After applying your filter options, simply click the “View Flow” button to access the flow chart.
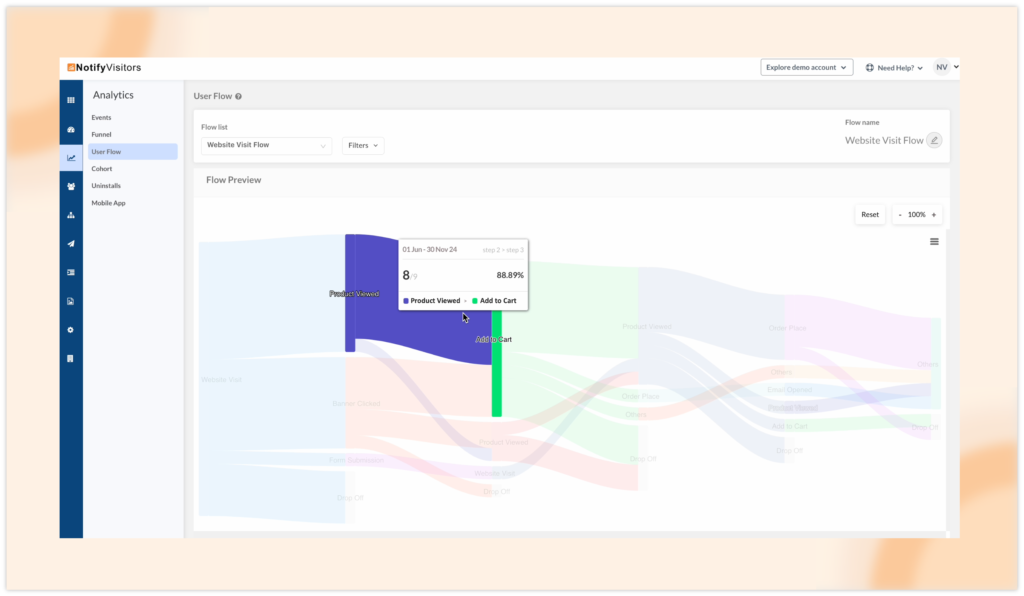
You’ll be presented with a user flow chart, showcasing events (steps performed by users) and paths flowing from left to right. The lines or areas linking two events indicate the path. You can refer to the image below for a visual representation.
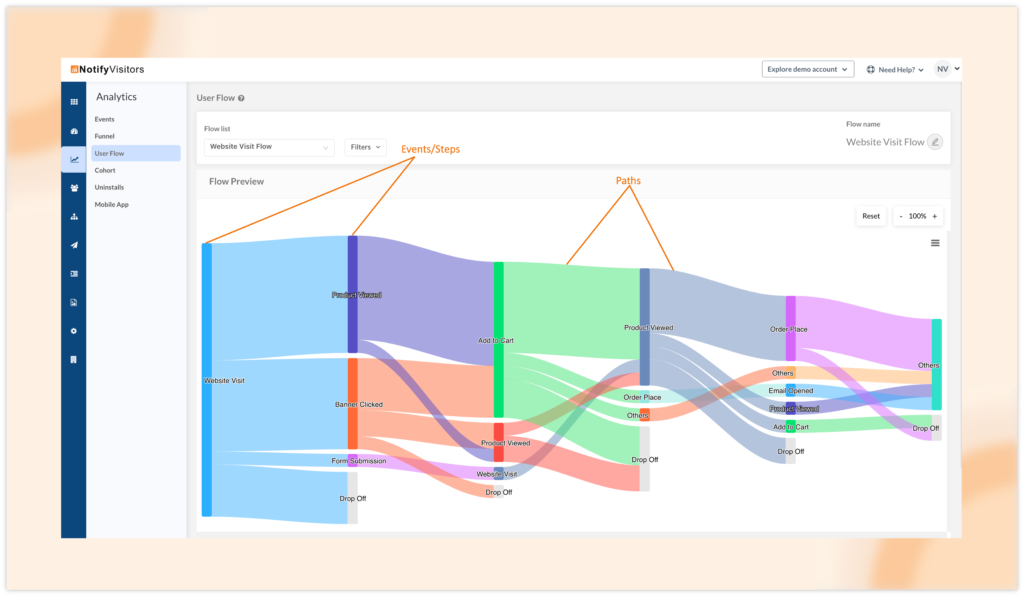
This visualization is particularly useful for spotting different variations of a similar path or for tracking a specific route. The height of each bar corresponds to the number of users who completed that particular event, while the height of the connecting lines reflects the number of users who perform the two events in sequence.
By hovering over an event, you can see the total number of users who reached that step from the previous one. It also provides insights into how many users dropped off after this event and how many proceeded to the next step.
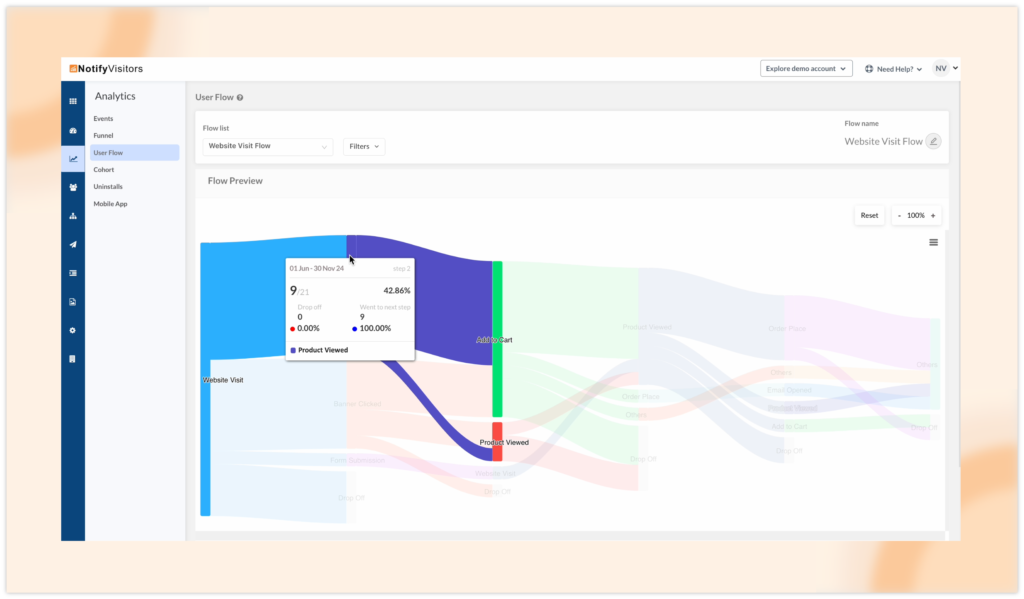
Similarly, by hovering over a path, you can view the number/percentage of users performed both adjoining steps/events of the path.
2. Upgrades made in the Funnel section
We have updated our funnel section with main features including strict ordering and breakdown funnel data based on events, user properties, or segments.
A. Funnel strict ordering feature
We’re excited to introduce the Funnel Strict Ordering feature, giving you more control over how you track user progress through funnels. When creating a funnel, you can now toggle the Strict Order option on or off.
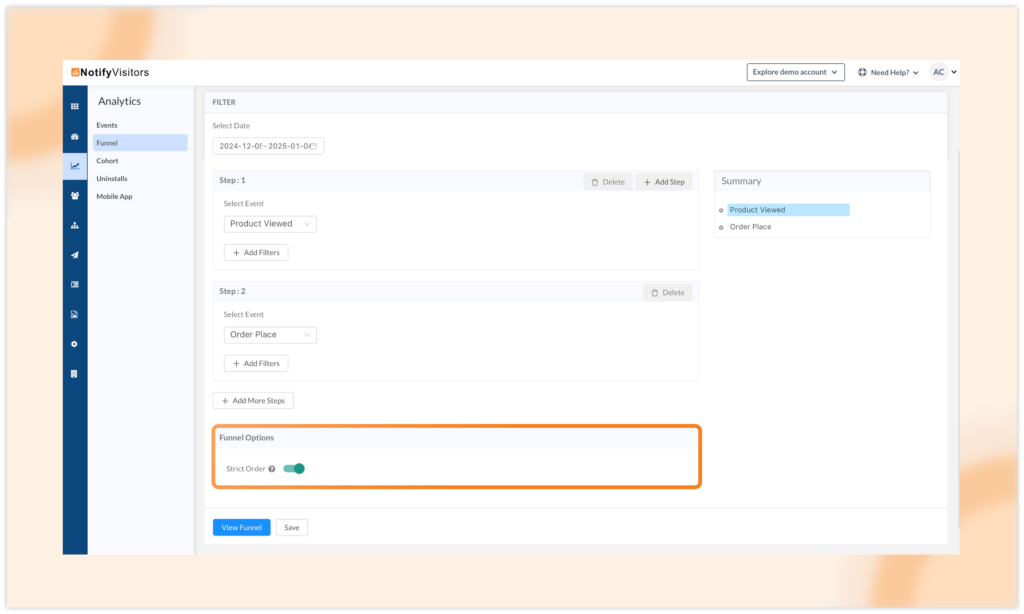
By default, Strict Ordering is On, meaning users will only be counted if they complete the steps in the exact order you’ve defined (e.g., Step A → Step B → Step C → Step D). If you disable this option, users will be allowed to complete the steps in any sequence, providing more flexibility in how you track their behavior.
Example:
Imagine you’re tracking a user’s journey through a multi-step loan application process on a banking website. With Strict Ordering enabled, users are counted in the funnel only if they first check their loan eligibility, then submit the application form, and finally upload the required documents in that exact sequence.
If Strict Ordering is disabled, users can complete these steps in any order—for example, some might upload documents before submitting the application, while others might check their eligibility after filling out the form. This flexibility helps identify different user behaviors and potential friction points in the process.
This feature allows you to create more accurate, tailored funnels that reflect your specific user flow, helping you better understand and optimize the user journey.
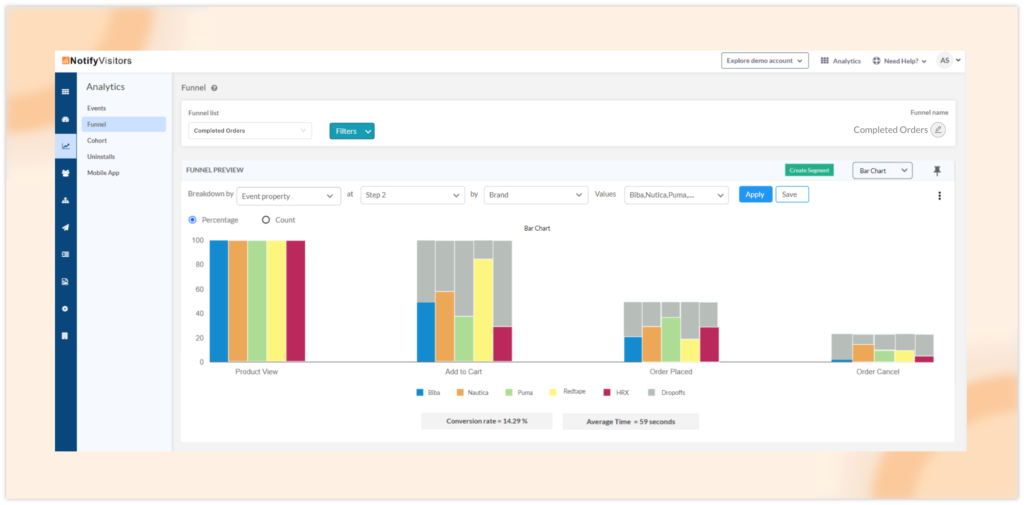
B. Funnel chart breakdown
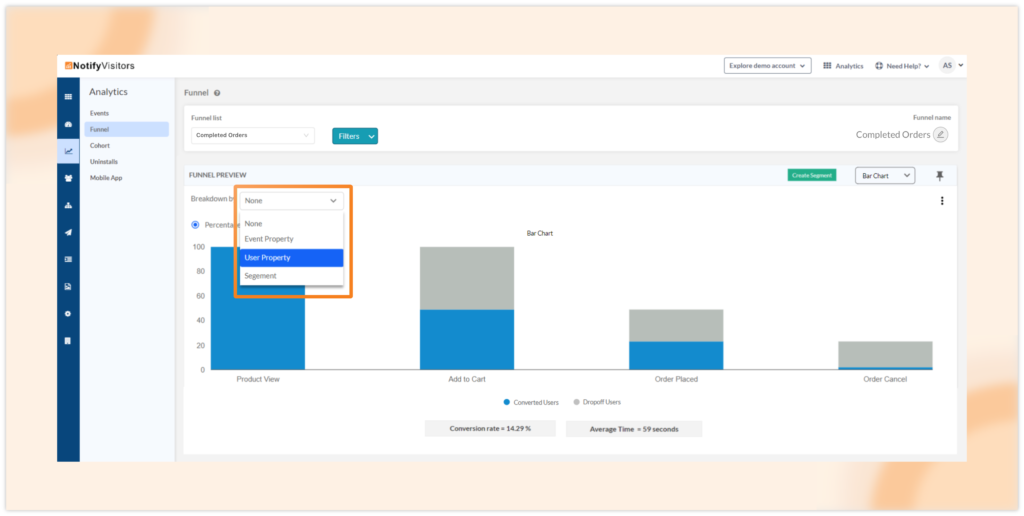
With the breakdown feature, you can break your funnel chart based on event property, user property, or segment. This option can only be used when viewing the funnel in bar chart format. You can do this by selecting the bar chart option from the right-hand side dropdown menu as shown in the image below.
Once you are presented with the bar chart, select the “Breakdown by” dropdown menu. Here you’ll get three options:
- Event Property
- User Property
- Segment
Event property
With this option you can break down your funnel data based on specific attributes of an event in your funnel. After selecting the event property you have to select the funnel step which is a specific event. Next, select the attribute type and its multiple values for which you want to break down the bar chart.
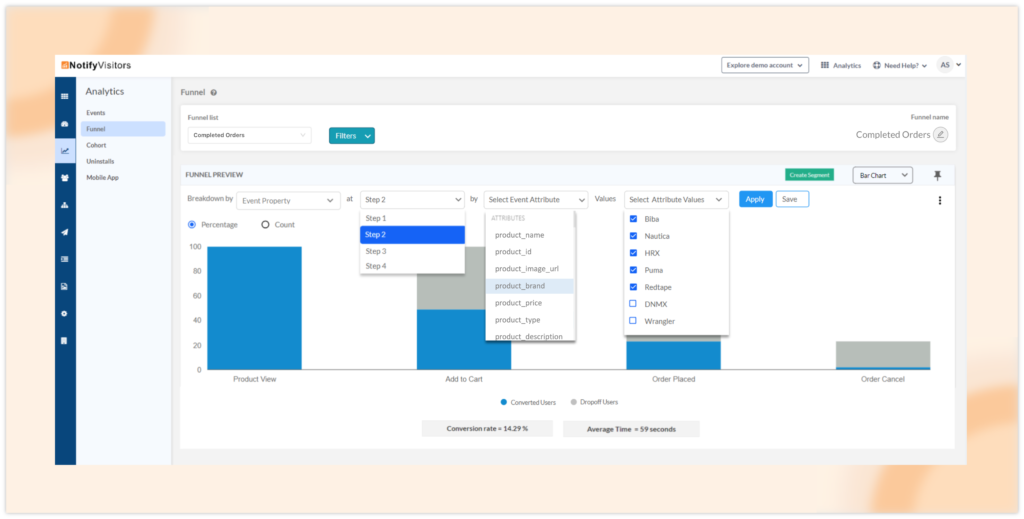
Lastly, select apply and the chart with breakdown values of your event’s attribute will be presented.
User property
With this you can select a user property and its specific values to break down the funnel bar chart accordingly.
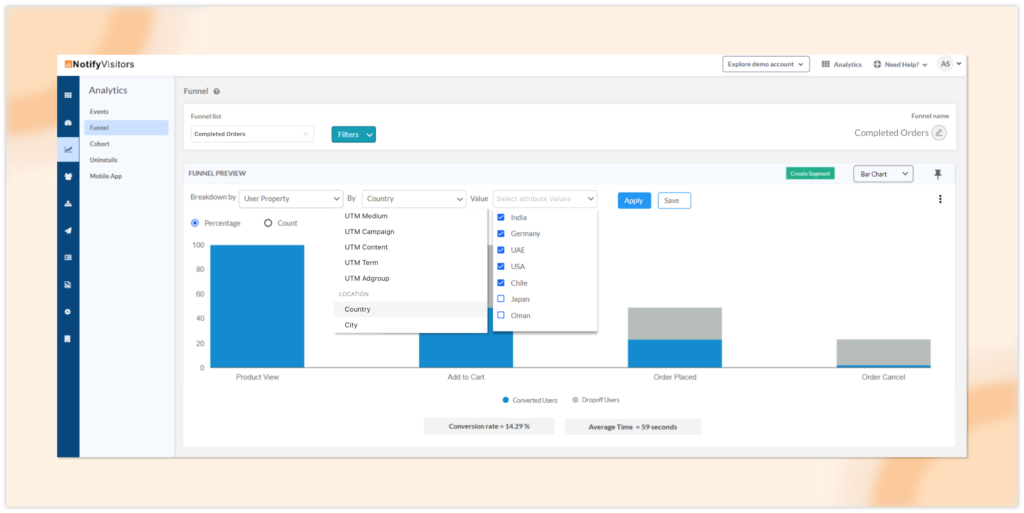
For example, you can select the country option, and then from the value dropdown you can select multiple countries to view each funnel step with a breakdown of specific countries users arrived from.
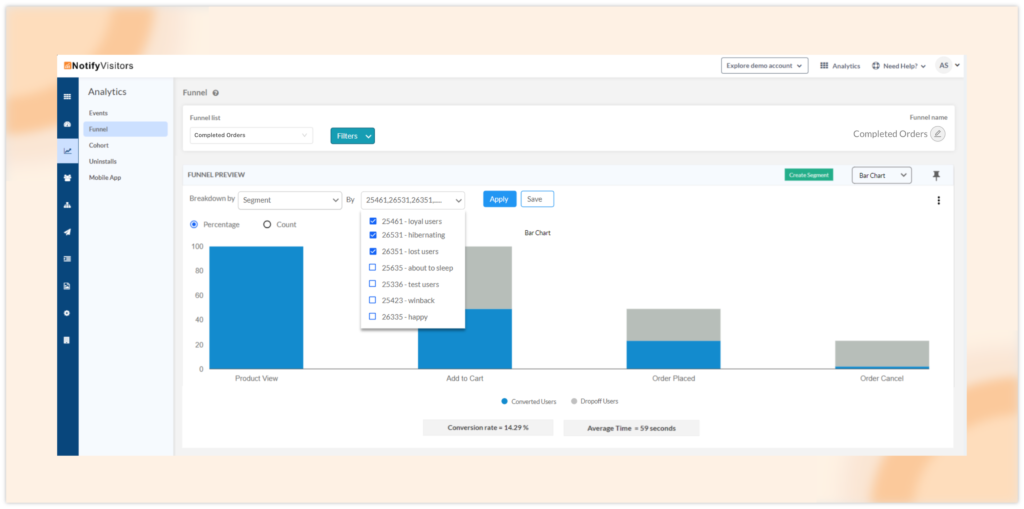
Segment
With this option you can select specific segments to break the funnel chart based on how many users from the selected segment have gone through the funnel steps.
3. Schedule reports for custom boards
This feature enables you to automate the delivery of custom board reports by scheduling them.
To schedule a report, first, navigate to Settings and select Schedule Reports. Here, click on the “Create new schedule report” button. Then, from the popup window that appears, choose Board Report from the report dropdown.
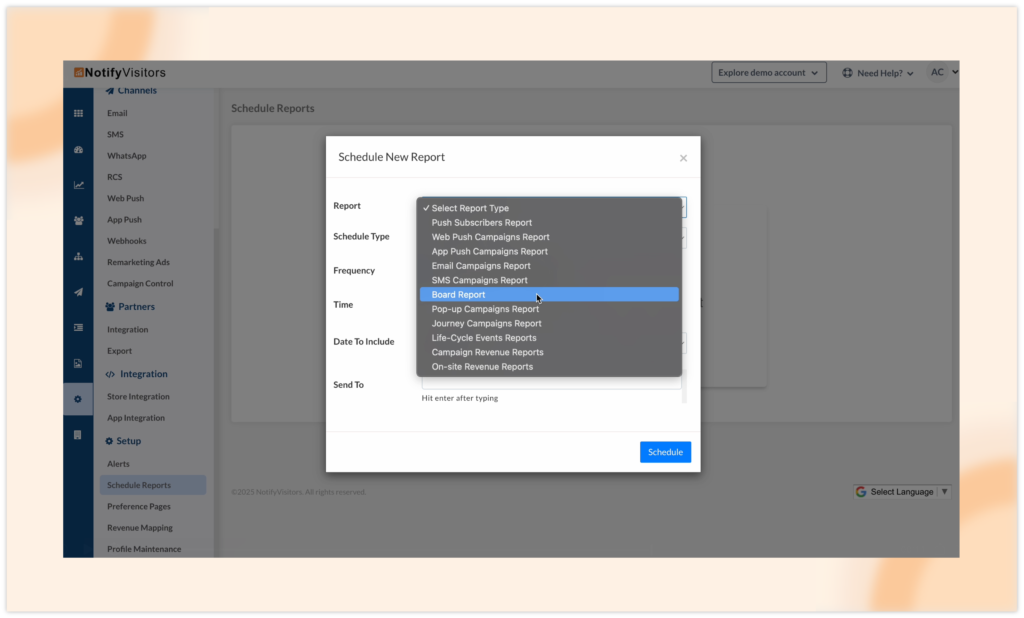
Next, select the board whose report you want to schedule from the dropdown list and configure the schedule settings such as schedule type, frequency, time, date, and recipients for the report. Once everything is configured, click Schedule.
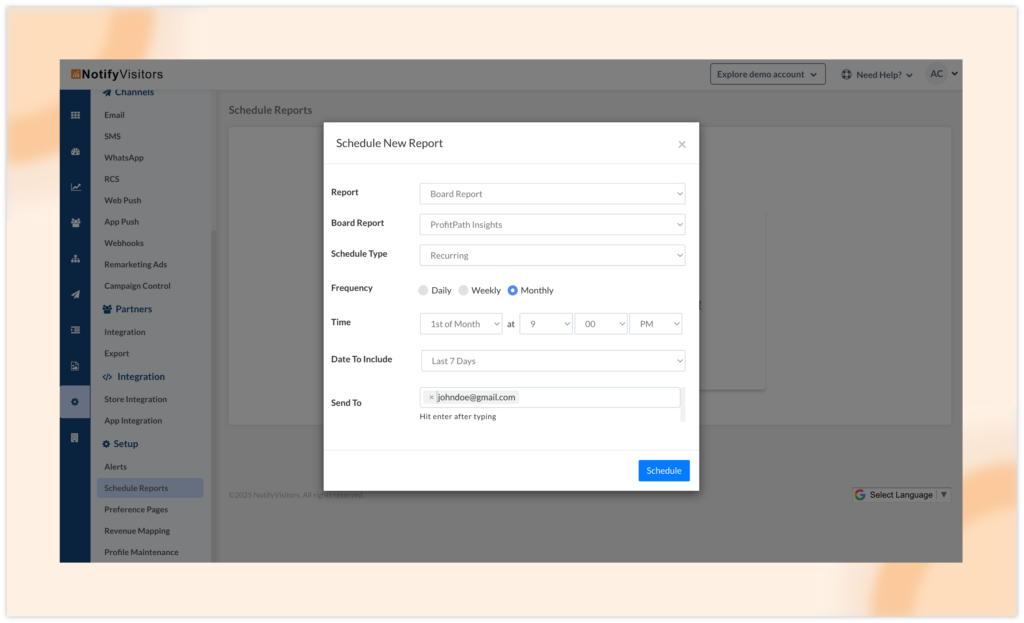
The system will then automatically send the reports according to the schedule you set. Each scheduled report will include all cards from the selected dashboard, with each card displayed on a separate sheet in the report file.
Conclusion
This release brings powerful enhancements to help you better analyze user journeys, track funnels with precision, and automate report scheduling for deeper insights. Whether it’s visualizing user flows, applying strict ordering in funnels, breaking down data for granular analysis, or automating custom board reports, these updates are designed to streamline your marketing efforts and improve decision-making.
To stay informed about our latest releases and access these features immediately, click the “Allow” button at the top of your screen for push notifications. For inquiries, suggestions, or a demo, reach out to us at support@notifyvisitors.com. Our dedicated team is ready to assist, ensuring you maximize the benefits of these enhancements.

At NotifyVisitors, we are constantly working to bring new features and improvements to our platform, based on the feedback and Read more

Introducing the May Release Notes – a roundup of the top upgrades and enhancements we've made to our platform this Read more

We are excited to announce a range of new features and enhancements in this month's release notes. These updates aim Read more

During this month, several significant updates have been implemented, with a primary focus on enhancing the marketing capabilities of our Read more